Posts

Assignment. 29th April 2019

Image
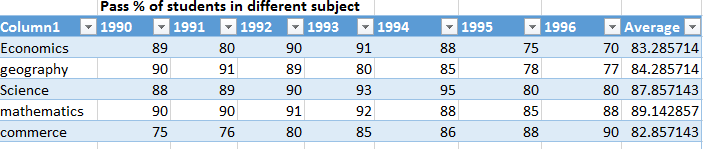
 2. The above chart and bar graph shows the pass percentage of 5 subjects from year 1990 to 1996. The chart display the  total pass percentage of 5 different subjects and bar graph represents the pass percentage from 1990-1996.overall commerce subject gradually increased to pass% where geography and science remained constants  and mathematics ans commerce remained fluctuated. X asix depicts the subject and year and Y asix shows the totals percentage of pass scores.

Reflection of today's

Today, we were introduced to the blog creation through gmail connection. the blog creation is mainly for the updating the data/information to personal pages, where other viewers can go through the blogs to get information and necessary comments too. How to create blogs? 1. type a create a blogs in the google, select a "create a blogger", through gmail connection. after completing the blogs, we were given to update in the  blog page, uploading of videos through URL links and link/ embedded to video and  uploading of graph, and tables. after completing the task, we were given individuals blog URL and made necessary comments to other blog pages. Thanks.

Students aggregate.

Image

Graphs

Image
https://www.youtube.com/watch?v=7q23JvpFcyw
https://docs.google.com/document/d/1_okyPTtEe2psNqthK0M3vVd3BLnTsjvepIiw_QXanqs/edit?usp=sharing https://docs.google.com/document/d/1_okyPTtEe2psNqthK0M3vVd3BLnTsjvepIiw_QXanqs/edit?usp=sharing

Recreational Area

With fastest growing and advancing of technologies and gadgets and daily activities of city life, most people were left often isolated and separated form nature.